首先导入相关库。
from sklearn import svm
import matplotlib.pyplot as plt
import numpy as np
%matplotlib inline
没有数据,瞎生成点数据
x0 = np.random.randint(0, 45, [50, 2])  #第一类点:在[0,0]到[45,45]之间的正方形内
x1 = np.random.randint(55, 100, [50, 2])#第二类点:在[55,55]到[100,100]之间的正方形内
X = np.concatenate([x0, x1])            #合并矩阵

y0 = np.zeros(50)    #第一类标签,以0表示
y1 = np.ones(50)     #第二类标签,以1表示
Y = np.concatenate([y0, y1]) #合并
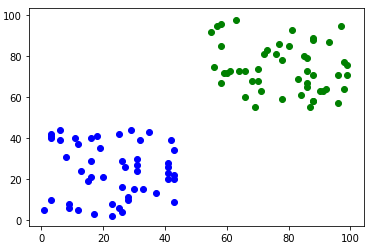
生成的点是这个样子的:

调用sklearn的svm算法
clf = svm.SVC(kernel="linear")
clf.fit(X, Y)
这样就成功分类了。接着来画超平面。
先print(clf.coef_)看一下权重矩阵:

有两个值,分别是W0和W1,sklearn中对超平面的表示并不是y=kx+b这样的,而是x作为第一个特征x0,y作为另一个特征x1,表示为:
这样的好处在于如果有多组特征,方便拓展。在预测时,将待预测的(x0,x1)带入上式,根据大于或小于0即可判断类别。
bias的值在使用clf.intercept_即可获取
为了方便画图,转成我们熟悉的斜截式,移项可得:
因此:
weight = clf.coef_[0] #取出权重矩阵
bias = clf.intercept_[0] #取出截距
k = -weight[0] / weight[1]
b = -bias / weight[1]
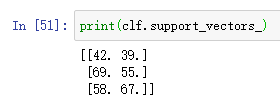
使用clf.support_vectors_可以获得支持向量

继续画图:
support_vector = clf.support_vectors_
#画出散点图
plt.scatter(x0.T[0], x0.T[1], c='b')
plt.scatter(x1.T[0], x1.T[1], c='g')
#画出支持向量
plt.scatter(support_vector.T[0][0], support_vector.T[1][0], marker=',', c='r')
plt.scatter(support_vector.T[0][1], support_vector.T[1][1], marker=',', c='r')
#画出超平面
x = np.linspace(0, 100)
y = k * x + b
plt.plot(x, y)
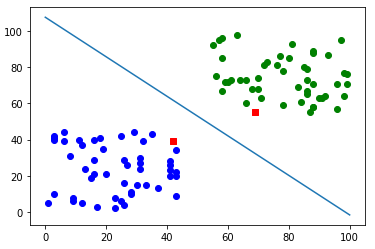
得到散点图和超平面和支持向量:

总结:
from sklearn import svm
import matplotlib.pyplot as plt
import numpy as np
%matplotlib inline

#生成数据
x0 = np.random.randint(0, 45, [50, 2])  #第一类点:在[0,0]到[45,45]之间的正方形内
x1 = np.random.randint(55, 100, [50, 2])#第二类点:在[55,55]到[100,100]之间的正方形内
X = np.concatenate([x0, x1])            #合并矩阵

y0 = np.zeros(50)    #第一类标签,以0表示
y1 = np.ones(50)     #第二类标签,以1表示
Y = np.concatenate([y0, y1]) #合并

#SVM
clf = svm.SVC(kernel="linear")
clf.fit(X, Y)

#获取超平面y=kx+b的k和b
weight = clf.coef_[0] #取出权重矩阵
bias = clf.intercept_[0]
# w0 * x + w1 * y + bias = 0
# y = - w0/w1 * x - bias / w1
k = -weight[0] / weight[1]
b = -bias / weight[1]

#画图
support_vector = clf.support_vectors_
#画出散点图
plt.scatter(x0.T[0], x0.T[1], c='b')
plt.scatter(x1.T[0], x1.T[1], c='g')
#画出支持向量
plt.scatter(support_vector.T[0][0], support_vector.T[1][0], marker=',', c='r')
plt.scatter(support_vector.T[0][1], support_vector.T[1][1], marker=',', c='r')
#画出超平面
x = np.linspace(0, 100)
y = k * x + b
plt.plot(x, y)

这是你自己写的网站吗?好好看呀!!!