0、决策树简介
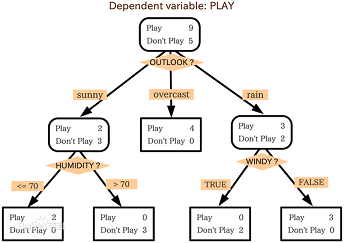
决策树是机器学习的一个重要算法,决策树就是像下面这样的树:

每个节点有属性的要求,根据不同的属性有不同的分支,叶子节点表示预测结果
1、使用sklearn构建决策树
在Jupyter Notebook导入相关库:
from sklearn.datasets import load_iris
from sklearn import tree
import sys
import os
from IPython.display import Image
import pydotplus
import pandas as pd
IPython.display的Image和pydotplus是为了可视化生成的决策树。没安装pydotpplus可以使用pip3命令安装。
接着用sklearn自带的鸢尾花数据:
iris = load_iris()嗯。。。让数据好看点?
table = pd.DataFrame(iris['data'])
table['target'] = iris['target']    # target => ['setosa', 'versicolor', 'virginica']
table.columns = ['sepal length (cm)','sepal width (cm)','petal length (cm)','petal width (cm)', 'target']
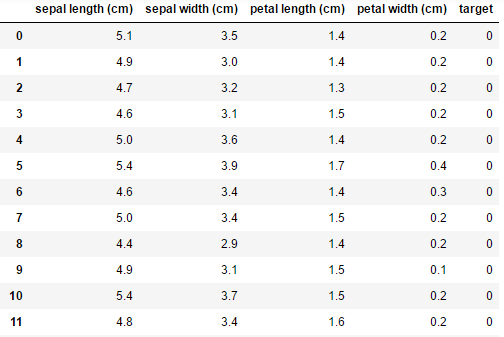
print(table)
数据集总共150个花,总共三种花,target表示了种类号,每个花有四个特征。下面利用这个数据构建决策树
# 创建决策树对象,使用信息熵作为依据
clf = tree.DecisionTreeClassifier(criterion='entropy')
# fit方法分类。features为iris.data,labels为iris.target
clf = clf.fit(iris.data, iris.target)
接着可视化一下这个树,看看它是什么亚子的
# 可视化
dot_data = tree.export_graphviz(clf, feature_names=iris.feature_names,  class_names=iris.target_names, filled=True)
graph = pydotplus.graph_from_dot_data(dot_data)
Image(graph.create_png())
如果报错:GraphViz's executables not found
你需要使用apt或者yum安装GraphViz。Windows需要下载一个工具,具体请百度一下。
nice!

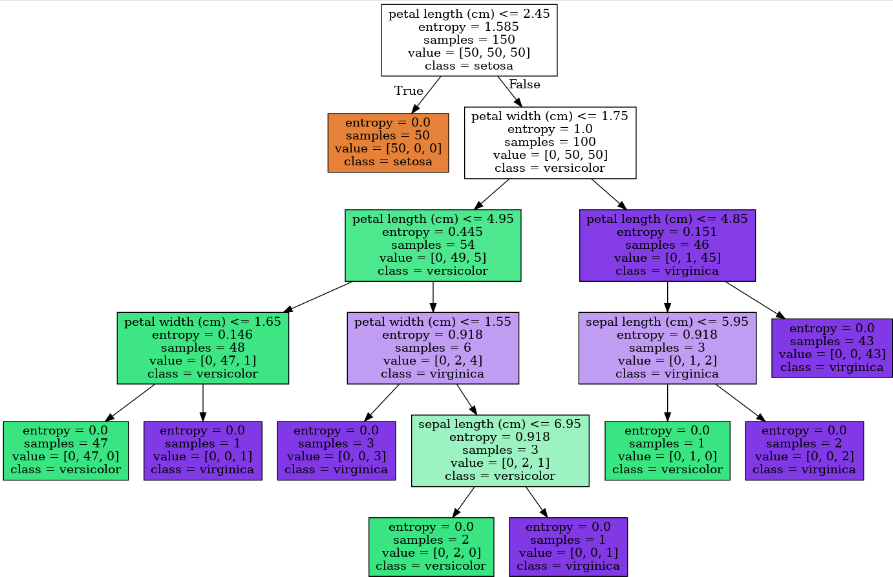
这就是生成的决策树,entropy表示的是熵,samples表示该节点所含样本数量,value表示不同类别的个数有多少。
这样,就完成了决策树的搭建。


想请教一下,最后的可视化能否换成具有指向性的文字符‘A -> B ',或者是字典,或者时json格式的样式。因为电脑配置有限,想减轻计算机的负担。